


Clement vs. Beale: An Early Comparison
Philippe Clement's managed 40% as many league matches for Rangers as Michael Beale did. How do his league results stack up to his predecessor's, and what's driving the changes?

We’ve reached the winter break in Scotland, a period during which every team will be analyzing how the first half of the season has gone, and where they can improve when play resumes. When it comes to Rangers specifically, we’ve also reached a stage where Philippe Clement has been in charge for long enough for us to begin to compare his results to those of his predecessor, Michael Beale. In this post, we’ll take an initial look at a Clement-vs.-Beale comparison to see how much things have changed, and why.
TL;DR
The underlying data on Clement-vs.-Beale is highly favourable to Clement, but it’s particularly on the defensive side of the game that Clement has made a difference.
Rangers are allowing fewer shots, and the shots they do allow are less dangerous.
As a result, Rangers are achieving better results despite not yet improving their scoring output under Clement.
There’s enough data for this to be interesting
Let’s start with some basics. Although Clement has won plaudits for winning the League Cup and delivering a Europa League group win, for the purposes of this post, we’re relying solely on data from league matches. Clement has managed 40% as many league matches as Beale did, so whilst it’s still early days, there’s a decent “body of work” to take a look at.
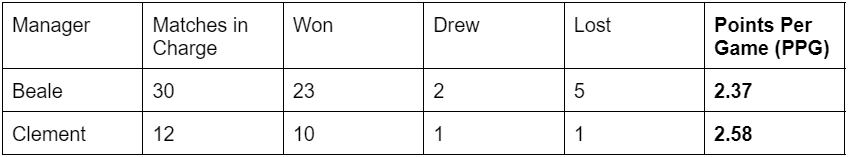
As shown above, Clement is so far delivering better results in the league, with Rangers winning about 9% more points per game. 9% may not seem impressive at first glance, but considering that the bar set by Beale was quite high, driving a 9% improvement is noteworthy, in my opinion. Let’s see if we can start to learn more about why Rangers are doing better under Clement. To do this, I’ve started with xG data I retrieved from FotMob.

Right away, we can see some data that seem quite important. Under Beale, Rangers averaged 1.5 more xG per match than their opponents. In other words, the shots Rangers took were worth 1.5 more xG than the shots Rangers allowed. This isn’t surprising, given Rangers’ tendency to have most of the ball against all domestic opponents bar Celtic. And an average Net xG of 1.5 is, in short, a lot.
As such, the fact that under Clement, Rangers’ Net xG has improved to 2.03 is impressive. Given that Rangers’ Net xG has improved by 35%, we shouldn’t be surprised that Rangers’ real-world results, as measured by points per game, have improved as well. As we get deeper into this analysis, we’ll take a look at how Rangers are accomplishing that improved Net xG. But first…
Improved xG hasn’t actually translated into more goals per game under Clement

Before we go too far down the xG rabbit hole, let’s pause to notice that, for all the improvement in xG (and Net xG), Rangers aren’t actually scoring any more goals under Clement than they did under Beale. Does this mean xG is all smoke and mirrors? No, not for me. It means that Rangers are creating more opportunities, but failing to take advantage of those additional opportunities. This may not sound surprising to those of you who have seen much of Cyriel Dessers (6 goals from 7.5 xG), Sam Lammers (2 goals form 4.1 xG), and others this season. Having said that, I do believe that if Rangers can maintain their stronger xG under Clement, in the long run it should translate into measurably better scoring output.
How are Rangers driving their improved Net xG?
With that aside out of the way, let’s take a look at how Rangers are achieving that stronger Net xG. Net xG, of course, is simply a function of xG for and xG against. We have seen that Clement has delivered improvement, relative to Beale, against both of these metrics. In other words, Rangers are creating more dangerous opportunities, and conceding fewer. That’s obviously a recipe for success, but you might be wondering: how has Clement done this? What’s changed? That’s a big question that likely has many answers. One aspect I’ve attempted to focus on is how the nature of Rangers’ chance creation might be evolving under Clement.
Is it all about xG per Shot?
One metric I’ve become interested in lately is the metric of xG per Shot. I don’t find this widely reported in mainstream outlets – even data-friendlier ones – but here’s why I’m interested in it. Under Beale, even back in the days when Steven Gerrard was manager, Rangers have often been criticized for being:
Unable to consistently break down low blocks
Satisfied to pass the ball in a “horseshoe” shape around a defence
Too willing to simply fling optimistic crosses into the box
Settling for long-distance, “low percentage” shots
I’ve certainly been annoyed by all of the above in recent years. So, I couldn’t help but wonder: are Rangers generating more xG (and better Net xG) because they’re getting better shots, as measured by xG per Shot?
The answer is, essentially, no. The table below shows the change from Beale to Clement in terms of xG per Shot, as well as some other interesting metrics.

As these data show, Rangers aren’t really getting better quality shots. (xG per shot has improved 2.6% under Clement, a difference that isn’t likely to be significant.) In fact, they’re not even getting more shots on target, because their “SOT Rate” has fallen quite a bit – only 32.6% of shots are hitting the target under Clement, down from 37.7% under Beale. So, the quality of shots is about the same, and actually fewer shots are hitting the target.
Instead, the story behind Rangers’ improved xG seems to be a much simpler one, so far. Rangers are firing off 2.5 more shots per game under Clement than they were under Beale, and since the quality of those shots is about the same, over time you expect that to have a helpful impact on Rangers scoring output.
It’ll be interesting to see whether the transfers Clement has input on (Fabio Silva is already in the door on loan from Wolves) lead to any improvement in shot quality. If they do, then the added output in terms of shots per game will be even more likely to impact Rangers “real-world” scoring.
What about the Defensive Side of the Game?
There’s a clearer story when it comes to the defence. Across all the metrics listed below, Clement has overseen clear improvement relative to Beale.

Firstly, opponents’ scoring is down nearly 50% (!). Improvement that extreme seems unlikely to hold up over the long run, but when we look at some of the contributing factors, we see reasons for Rangers supporters to be optimistic about what Clement is doing.
After all, it’s no surprise that opponents are scoring fewer goals. Rangers are allowing 10% fewer shots per game, and less dangerous shots at that. As you can see with the xG per Shot Allowed data, the shots Rangers are facing are about 12% less dangerous under Clement.
So what does it all mean? What should we expect from here?
Any good analyst will be asking why Rangers are allowing fewer shots, and why those shots are less dangerous. He or she will be asking why Rangers’ improved xG isn’t translating into more goals. While we have enough data to start to observe some interesting trends, it’s early days yet, so we won’t go deeper into how tactics or other factors are enabling Clement to drive these improvements. However, I’d love to hear your ideas and your feedback, so please do leave a comment if you have your own explanations to offer, questions about anything I’ve written, or a different perspective entirely.
In the meantime, Rangers will be hoping to see their scoring output improve, and not just because they’re firing off more shots. On the other side of the ball, they’ll want to continue their strong defensive performance under Clement so that the likes of Dessers and Silva have some “breathing room” to find some form.
Appendix: Data excluding matches against Celtic
When I was reviewing this data for this post, I wondered whether Clement was perhaps benefiting from only having faced Celtic once in 12 matches (8.3%), compared to Beale having faced Celtic four times in 30 (13.3%). So, I removed data from matches against Celtic from the dataset, and reached similar conclusions.

As you’d expect, both managers show better performance against each of these metrics when excluding data from matches against Celtic. However, the idea that Clement is delivering stronger performance than Beale holds up. This can’t be explained away by Beale having faced Celtic more often than Clement has so far.